Guest Post: Bearish Wedge Continues… For Now
By Adam Sarhan, Contributor, SarhanCapital.com
Bearish Wedge Continues… For Now
Two weeks before the end of August crash, I published an article on GaryK.com (here) titled, “Market Looks Toppy & A Closer Look At The Dow.” And wrote, “The market is getting weaker, not stronger. We are continuing to see more and more deterioration occurring as the major indices look toppy up here. The tape continues to break down. The bull market is over 6.5 years old and that is considered an aging bull by normal historical measures. Notwithstanding more easy money from the Fed and other central banks, a break of support will add to the misery.” Then on August 20, 2015 the S&P 500 broke below support of its large topping pattern and crashed on the following Monday (8/28/15). Since then, the major averages formed a bearish wedge as they pause to digest the very steep sell-off. Near term resistance for the S&P500 is 2020 and very important support is 1867. Keep in mind we are headed into end of month and end of quarter window dressing. Bounces may (and most likely will occur) but the broader action remains bearish for now.
What A Bearish Wedge Looks Like
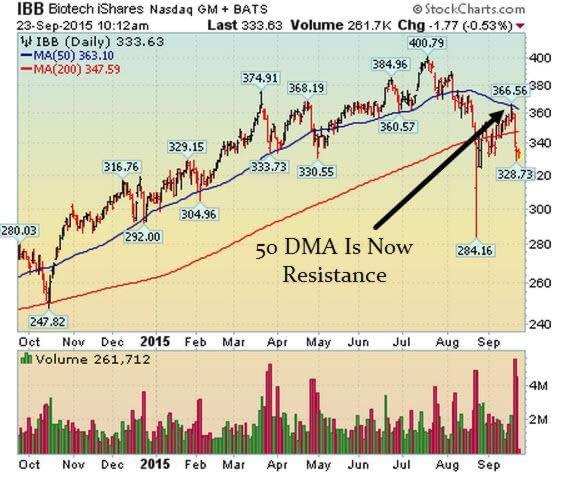
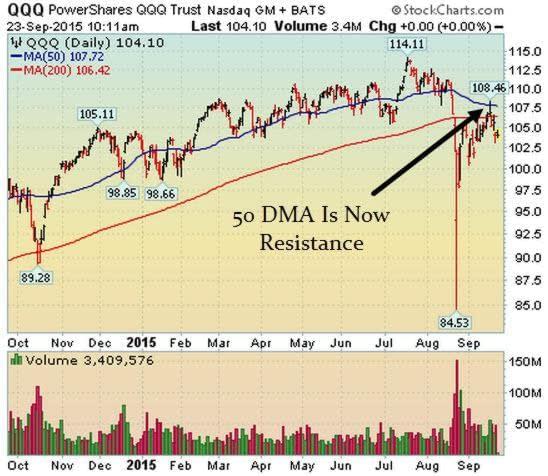
In uptrends, markets pull back and bounce off their ascending 50 DMA lines. In downtrends, the exact opposite happens. The market rallies into and encounters stubborn resistance near its descending 50 DMA line. The major averages were deeply oversold on Monday 8.28.15 and spent the past few weeks moving sideways to work off that condition. In near text book fashion, the major indices and several important sectors, rallied into their descending 50 DMA line before failing after the Fed meeting and rolling over. Take a look at where the Nasdaq Composite ($COMP), Nasdaq 100 ($QQQ), Biotechs ($IBB), Netflix ($NFLX) just to name a few…
Biotechs
QQQ
Bottom Line:
In our Aug 6 report we wrote, “The writing is on the wall for a classic topping process. If support breaks, odds favor lower prices will follow.” Right now, even fewer stocks are in healthy technical shape and the major averages are forming a bearish wedging pattern. A break below major support (1867 in the S&P 500 8/28/15’s low) will trigger a new leg lower. Until then we have to expect this sloppy action to continue.
HI Gary I wanted to comment on something you said about a man can fall and can get back up again. That just because I have failed does not mean its over. I guess I needed to hear it from you. A heartfelt thank you!