Anatomy Of A Top: Apple Inc $AAPL
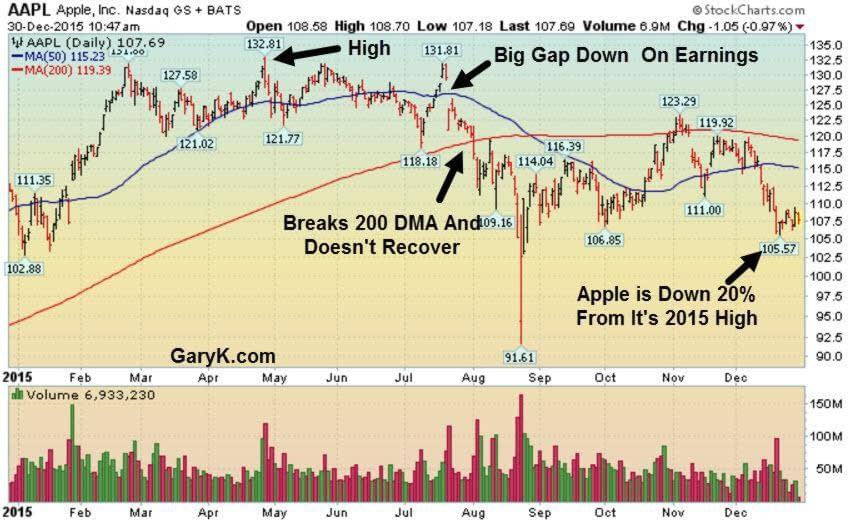
Normally when we write to you about another “anatomy of a top” lesson, the stock is down 50% if not more. But today we want to do “anatomy of a top” for Apple. The reason being is that Apple has been a leader of the NASDAQ 100 and now it is a laggard. With the NASDAQ 100 just below its high, Apple is now sitting 20% below its all-time high (and 2015 high) and near closing yearly lows. This is not normal for this leading stock and calls into question what a few analysts as well as suppliers are saying.
Decelerating Fundamentals:
On the fundamental side, Apple’s last four quarters were stellar with earning’s increases of 48%, 40%, 45%, 38%. But for the December quarter, estimates are only for a single digit gain. Giving room for Apple’s usual sandbagging the number, it will still be a major deceleration from previous quarters. As usual, we will know a lot more when they report earnings in late January but for now, let’s take a look at what we consider to be important under-performance in the stock.
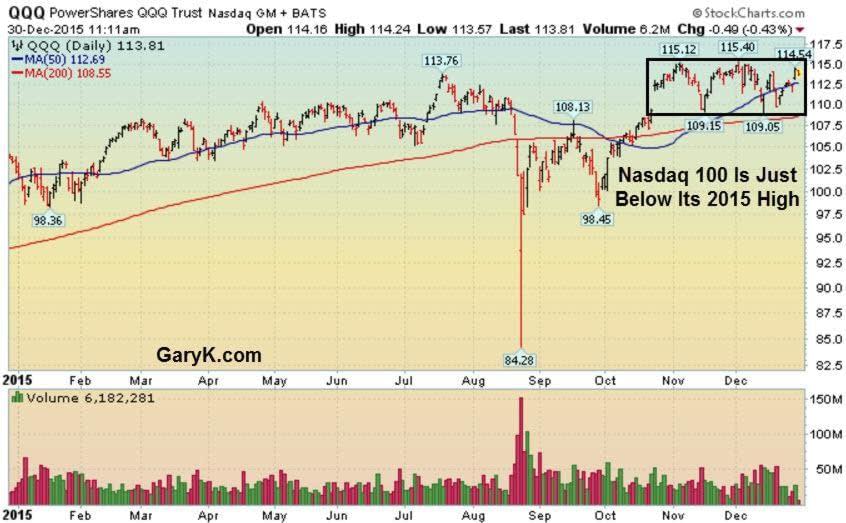
The first chart is the NASDAQ 100-the second chart is Apple. A simple glance at both show Apple’s under-performance.
Nasdaq 100:
Apple Inc: $AAPL
How The Top Formed:
For those who have owned Apple stock for the past 10 years you probably want to ignore what we’re about to say but for those who are active, Apple’s action remains worrisome.
- For starters, on July 22, the stock gapped down below its 50 day moving average. The stock had basically done nothing since February but that’s not such a big deal. The gap was a big deal as the stock has never recovered higher than the gap. A gap like this very often takes the air out of a stock, at least for the near term.
- The next point we want to make is to notice how Apple has stayed below the 200 day moving average since August 3 when it broke below. This long term moving average stopped the stock dead in its tracks in November. To be clear, it is never good when a stock trades below the 200 day. We certainly have no interest in anything below that level.
- We then want you to notice as the NASDAQ 100 got back to highs into November, Apple never got close. This easily tells you that Apple is now an under-performing stock.
- And now, as the NASDAQ 100 trades in and around its highs over recent weeks, Apple trades in and around its lows. We also notice it has no ability to rally while markets have rallied into the end of year.
We bring this up because every great stock in history has eventually hit its wall. This is because companies get too big, leading to slowing growth or competitors come in and beat them at their own game. Both analysts and suppliers are now saying that iPhone sales are slowing. In fact, we are hearing suppliers have been cutting back on their own orders. We suspect both are playing into what’s happening with the stock.
Keep in mind, Apple is arguably the most over-owned and beloved stock in the market’s history. This is great news as the stock goes higher. It is terrible news when a great stock tops out as all that’s left is sellers. Everyone who wants to buy, has already bought. A quick glance at many top mutual funds will show just about all own significant positions in the stock. As well, many hedge funds have been over-weighted in the stock. As always, this is a glance of the stock at one given point in time. We just wanted to let you know the stock is acting suspect at this time. We will know a lot more come late January when they report earnings.
Positions held- None!
Thanks for the article. Any opinion on this? Do you trust the projections? http://www.aaplbeat.com/charts/
Thanks for the analysis on APPL., and your great insights!! I really like your perspective on stocks and the market. 41 analysts covering APPL give target price of 115-200 (yahoo fin.) so is a tempting BUY, but ONE look at path- etic APPL chart says BIG “NO”4me!!!!
Thx Gary!!