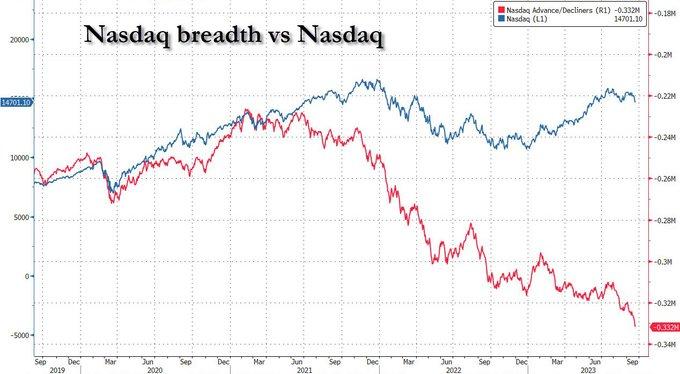
What is not said in this chart is that the Nasdaq AD line is HEAVILY weighted toward Small and Mid cap stocks, as opposed to the NYSE or even the NDX AD lines, which are more representative of the market.. Small and Mid Caps have been trending lower for a year,, so this is not at all surprising. Good to know the whole story.
The advance-decline statistics have a few quirks that chartists should understand. First, the Nasdaq AD Line can fall for extended periods, even if the Nasdaq itself is rising. This is because Nasdaq listing requirements are not as strict as NYSE listing requirements. The Nasdaq is full of upstarts in industries ranging from biotech to technology to alternative energy. There may be huge upside potential, but there is also a risk of absolute failure. This means more Nasdaq stocks are prone to delisting. Companies that fail are removed from the index and replaced, but their negative effect on the AD Line remains.
Second, the advance-decline statistics favor small-cap and mid-cap stocks over large-cap stocks. Thousands of stocks trade on the Nasdaq and NYSE every day and the vast majority of these stocks are small- and mid-cap. Relatively few are large-caps. Regardless of market cap or volume, an advance counts as +1 and a decline counts as -1.
Eye-opening.
What is not said in this chart is that the Nasdaq AD line is HEAVILY weighted toward Small and Mid cap stocks, as opposed to the NYSE or even the NDX AD lines, which are more representative of the market.. Small and Mid Caps have been trending lower for a year,, so this is not at all surprising. Good to know the whole story.
The advance-decline statistics have a few quirks that chartists should understand. First, the Nasdaq AD Line can fall for extended periods, even if the Nasdaq itself is rising. This is because Nasdaq listing requirements are not as strict as NYSE listing requirements. The Nasdaq is full of upstarts in industries ranging from biotech to technology to alternative energy. There may be huge upside potential, but there is also a risk of absolute failure. This means more Nasdaq stocks are prone to delisting. Companies that fail are removed from the index and replaced, but their negative effect on the AD Line remains.
Second, the advance-decline statistics favor small-cap and mid-cap stocks over large-cap stocks. Thousands of stocks trade on the Nasdaq and NYSE every day and the vast majority of these stocks are small- and mid-cap. Relatively few are large-caps. Regardless of market cap or volume, an advance counts as +1 and a decline counts as -1.